When Kubernetes and Go don't work well together
Go is not aware of the limits set for its container, causing some issues not easy to track. This is a story about how I stumbled into one of them.
Originally from Visoko, currently in Sarajevo, Bosnia and Herzegovina. Backend developer, software architect, climber.

In this article, I will cover a specific issue encountered in one of our production environments, go over the root cause, and a potential resolution. The title hints at the underlying problem, but we will cover the details of what happened.
What happened?
I got a bug report that there is a 502 Bad Gateway error happening when one of our API service endpoints, in a specific production environment, gets called. The calls for the same API endpoint are successful in all other production environments, just not this one.
Started with checking the usual stuff. Error logs, nothing. Tried to reproduce it, the issue is still there, but there aren’t any error logs or any other logs, at all. I noticed that the Kubernetes pod container gets restarted each time I call the API service endpoint. The first thought that came to mind was that the service panicked and the container restarted, so there must be logs in the previous pod instance. Checked there, nada. Next, I added more info logs to see where the issue happened exactly. It pointed to the issue happening when the json.Marshalfunction call was being executed, but there was nothing odd in the code. It was time to dig a bit more.
I shifted my focus to the Kubernetes pod and how it behaves when the issue happens. While the new pod is starting, I notice that the old pod has the OOMKilled status. OOMKilled? But that’s out-of-memory status when the container inside the pod goes over the defined RAM limit. What the hell is this API endpoint response trying to return?? To be fair, we built this endpoint to retrieve the bulk data for our mobile app so it can work in the offline mode. Even so, I didn’t expect that there would be that much data because these are the resource limits for the API service container:
# part of the deployment file
- name: api
  image: gcr.io/xyz/api:989d83a73a9d1605ac601e3ef0fdef5711dcffe4
  imagePullPolicy: Always
  ports:
  - containerPort: 5500
  resources:
    limits:
      cpu: 200m
      memory: 400Mi
    requests:
      cpu: 100m
      memory: 200Mi
The RAM limit for the API service container is 400 MB. I doubled the RAM limits to see how far this issue goes. The deployment was reconfigured and a new pod with the new container limits was deployed. I triggered the API endpoint again and it returned the response successfully. The size of the response is 66 MB.
Hmm, the API service container with RAM limits of 400 MB should have been able to handle the 66 MB response with ease. How did it go out of memory then? After reading through some documentation and articles about Go internals (see the references at the end), some hunches about Go’s garbage collector started to form.
As Monk would say, here’s what happened…
Two things are important to explain how the issue manifests.
First, the Go’s garbage collector. I won’t go into all the details on how Go’s garbage collector works. I linked some great articles at the end if you want to read more about the details. One important detail for the issue at hand is that Go’s GC expands the heap memory when needed. At each Go’s GC run, it determines if more memory needs to be allocated, and then allocates it.
Next, this is the part where we go back to the title of this article. When the Go program (as a single process) runs in a container in a Kubernetes pod, by default it doesn't know about the resource limits set for the container it is running in. For example, let's say that our container is running on a multi-core machine with 8 GB of RAM. Assuming the heap continually rises, the Go runtime will eventually try to allocate all available memory of those 8 GB, even if other containers are deployed on that same machine, running other processes.
Combining these facts, we get how the issue manifests. While executing the json.Marshal function, the Go’s GC sees there is a need for more heap memory, and allocates it. It does that repeatedly in several GC cycles. When the process in the container goes over the memory limit (400 MB), the container’s system kernel terminates the process, with an out-of-memory error (OOM).
Hunches are fine, but show me the facts
Let's check GC trace logs to get some data on what happened. You can check these logs by setting the environment variable GODEBUG=gctrace=1. There are a few ways to do it, I added it to my Dockerfile.
#The last part of the multi-step build
# Build minimal image
FROM alpine
COPY --from=0 /go/bin/api /go/bin/api
ENV GODEBUG gctrace=1
# Expose port
EXPOSE 5500
# Run
ENTRYPOINT [ "/go/bin/api" ]
Looking at the logs below, there is one more thing to note. There is another environment variable, GOGC, that determines how much the allocated heap will grow before the next GC run. GOGC is set by default to 100, which means it will grow by 100%.
{"level":"info","msg":"GetBulkDmsFiles: done","time":"2024-02-25T16:06:08Z"}
{"level":"info","msg":"marshal response","time":"2024-02-25T16:06:08Z"}
gc 14 @247.533s 0%: 0.073+195+0.040 ms clock, 0.14+0/10/97+0.080 ms cpu, 138->138->117 MB, 138 MB goal, 0 MB stacks, 0 MB globals, 2 P
gc 15 @248.448s 0%: 0.061+280+0.041 ms clock, 0.12+0/89/2.9+0.082 ms cpu, 309->309->260 MB, 234 MB goal, 0 MB stacks, 0 MB globals, 2 P
From the logs, we can see that the heap grows with each GC run. Please note that the last entry has 260 MB, which is what the Go program was able to write before it got terminated. In the next GC run, the heap would grow over 500 MB, more than the 400 MB limit defined in the deployment file for the API service container.
Is there a solution for this?
Everyone’s favorite answer, it depends. Some will prefer to leave this as is, to have a container that fails fast, not to tinker with how the GC works, and to deal with the functionality itself. This API endpoint that returns bulk data could have been rewritten to stream the data back, rather than to send one big response.
However, if it bothers you that your Go program and Kubernetes are kind of out of sync, there is a way to tune it to work more smoothly. The GOMEMLIMIT environment variable, introduced in Go 1.19, can be used as a soft memory limit for the GC. The OOM can still happen, but the GC will run more aggressively when it reaches the limit and will make sure to use all of the live heap rather than keep increasing the heap beyond the limit.
In the API service’s deployment YAML file, I’ve added this environment configuration:
env:
  - name: GOMEMLIMIT
    valueFrom:
      resourceFieldRef:
        resource: limits.memory
The GOMEMLIMIT is set to whatever is defined as a memory limit in the deployment YAML file. This way, whenever I change the memory limits, the GOMEMLIMIT will be changed accordingly.
It would be better to be able to define something like “90% of the memory limits”, but there is still no good way to do this, other than maybe using requests.memory. This issue is still open.
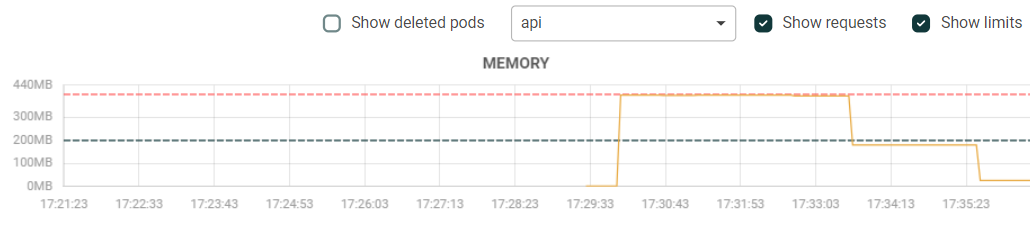
When I call the same endpoint, it returns the response successfully. Here are the GC logs and what the memory looks like before and after the call.
{"level":"info","msg":"GetBulkDmsFiles: done","time":"2024-02-25T16:31:01Z"}
{"level":"info","msg":"marshal response","time":"2024-02-25T16:31:01Z"}
gc 18 @92.420s 0%: 0.053+190+0.097 ms clock, 0.10+0/98/95+0.19 ms cpu, 115->115->93 MB, 125 MB goal, 0 MB stacks, 0 MB globals, 2 P
gc 19 @93.019s 0%: 0.066+102+0.035 ms clock, 0.13+0/4.0/89+0.071 ms cpu, 189->189->165 MB, 186 MB goal, 0 MB stacks, 0 MB globals, 2 P
{"level":"info","msg":"marshal response done","time":"2024-02-25T16:31:02Z"}
gc 20 @93.821s 0%: 0.066+193+0.004 ms clock, 0.13+0/2.6/3.6+0.009 ms cpu, 359->359->197 MB, 330 MB goal, 0 MB stacks, 0 MB globals, 2 P
{"level":"info","msg":"response writer write done","time":"2024-02-25T16:31:10Z"}
Final thoughts
The presented solution is no silver bullet. There are scenarios where failing fast with the default settings is preferable to squeezing all the juice from the heap before the process is terminated with the OOM error.
That being said, the presented solution might help with better resource utilization, especially when multiple services are deployed on the same machine.
There is a great article about this topic already out there. I found out about it kinda late, it would have saved me a lot of time (by not writing this one haha). You should read it to get even more familiar with the topic.
Please let me know if there are similar and more elegant solutions to tune your Kubernetes resources and Go programs, I would like to hear about it!
References
Ardan Labs article about tuning the CPU limits (I got the idea from there) — https://www.ardanlabs.com/blog/2024/02/kubernetes-cpu-limits-go.html
A cool article about
GOMEMLIMITthat has way more details — https://weaviate.io/blog/gomemlimit-a-game-changer-for-high-memory-applicationsThe article on the same topic — https://billglover.me/2022/09/14/use-the-kubernetes-downwards-api-to-set-gomemlimit/
A guide to the Go’s garbage collector — https://tip.golang.org/doc/gc-guide


